iNaturalist Observations - PowerBI - API Paging
This is a continued exploration of using iNaturalist APIs in Power BI (see related content below). The first example of iNaturalist data in Power BI loaded and visualized observation data for a taxon id, however this API has a record limit of 200 results per page, which means it will take multiple API calls to load all the data for a single taxon.
In order to get the full API results we need to make multiple calls to the API passing a page parameter. This article provides a good discussion of importing API results for page-limited APIs:
To get all of the data from the observations api:
1. Modify the original observations query to make it a function query that accepts a page number parameter
2. Create a new query that returns a list of page numbers for the full set of results
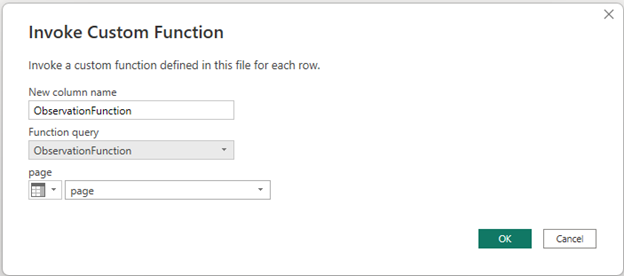
3. Use Invoke Function column operation to call the api for each page
Here are the details:
1. Convert original api query to a function query with a page parameter:
(page as text) as table=>
let
    Source = Json.Document(Web.Contents("https://api.inaturalist.org/v1/observations
        ?taxon_id=42391&per_page=200&order=desc&order_by=created_at&page=" & (page))),

... [additional power query transformation steps to expand and select desired columns]
2. Create a new query that returns a list of page numbers expected from the api method:
let
Source = Json.Document(Web.Contents("https://api.inaturalist.org/v1/observations
?taxon_id=42391&per_page=200&order=desc&order_by=created_at&only_id=true")),
//calculate number of pages in total_results and convert to a table of page values
pages = Number.Round(Source[ total_results] / Source[ per_page],0),
pageList = {1..pages},
pageTable = Table.FromList(pageList, Splitter.SplitByNothing(), null, null, ExtraValues.Error),
pageTable_renamed = Table.RenameColumns(pageTable,{{"Column1", "page"}}),
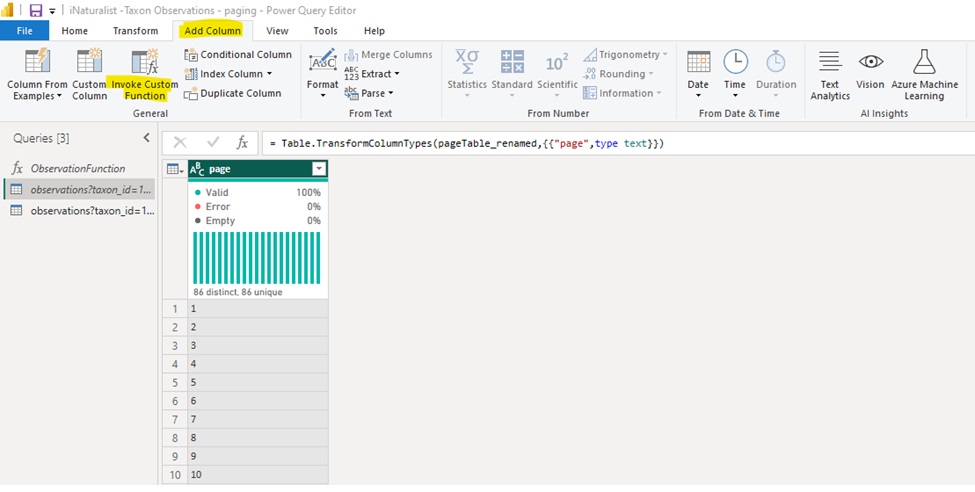
pageTable_final = Table.TransformColumnTypes(pageTable_renamed,{{"page",type text}})
in
pageTable_final
This produces a simple table of numbers:
/images/Data%20Visualization%20at%20the%20USDA/CDL_Cropscape.jpg
3. From here we can use Invoke Custom Function in the designer and select the function query from Step 1.
Now we have all of the api data from the iNaturalist observations api in one Power BI table.
iNaturalist Observations by Taxon ID - Power BI - with paging
Related Content:
iNaturalist APIs
iNaturalist Observations - Power BI
Paging REST API results in Power BI
API Paging, Power BI, iNaturalist — Nov 7, 2024