Data Visualization at the USDA
Today’s USDA Agriculture Outlook Forum included a session on a wide variety data visualization apps that are readily available for public use. These data tools provide simple, intuitive interfaces for mapping and visualizing crop and natural resource data. Advanced features, downloadable data sets and API integrations. Joe Parsons, Chair of the agricultural board statistics introduced the session and subject area speakers provided quick demos these visualization tools, which I will be exploring in more detail. Links and descriptinos of these public data assets are outlined below.
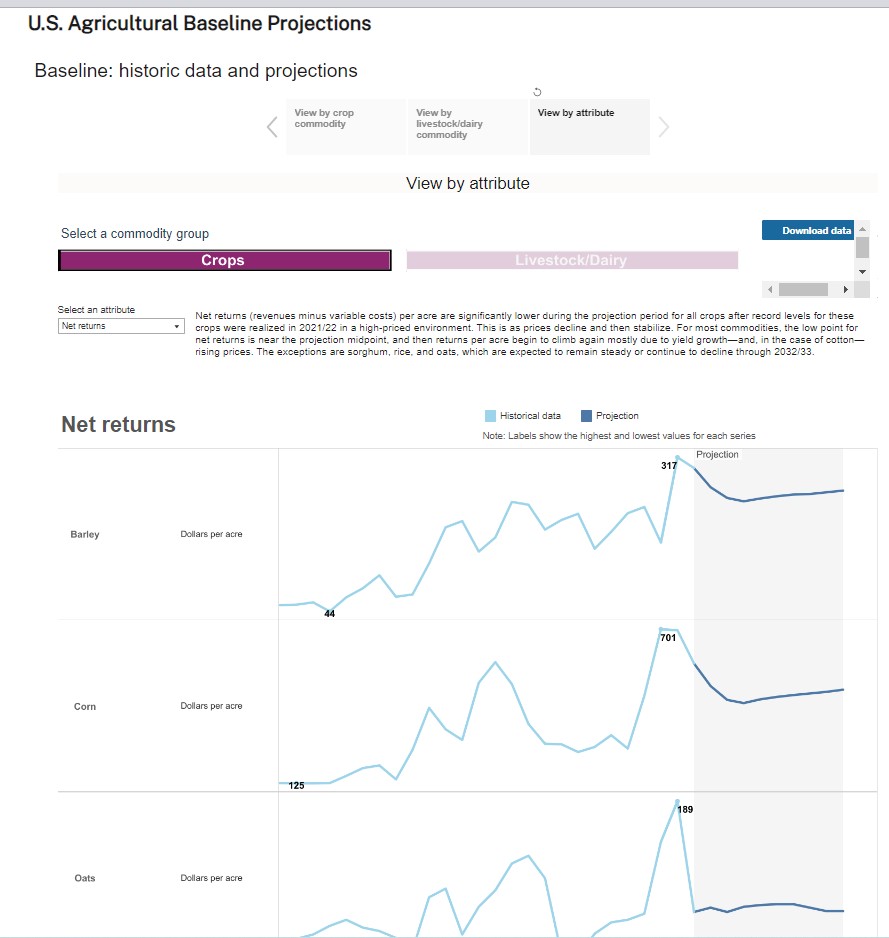
Agriculture Baseline Projections, presented by Matthew Miller
Developed by USDA Economic Research Service (ERS) for long-term (10-year) supply and demand projections. The projections use a composite of multiple economic models and are used by USDA for estimates of program budget outlays and forecasting. Data is updated annually. Below is the link to the visualization tool for baseline projections.
| Link to App or Dataset | |
|---|---|
| Agriculture Baseline Projections |
|
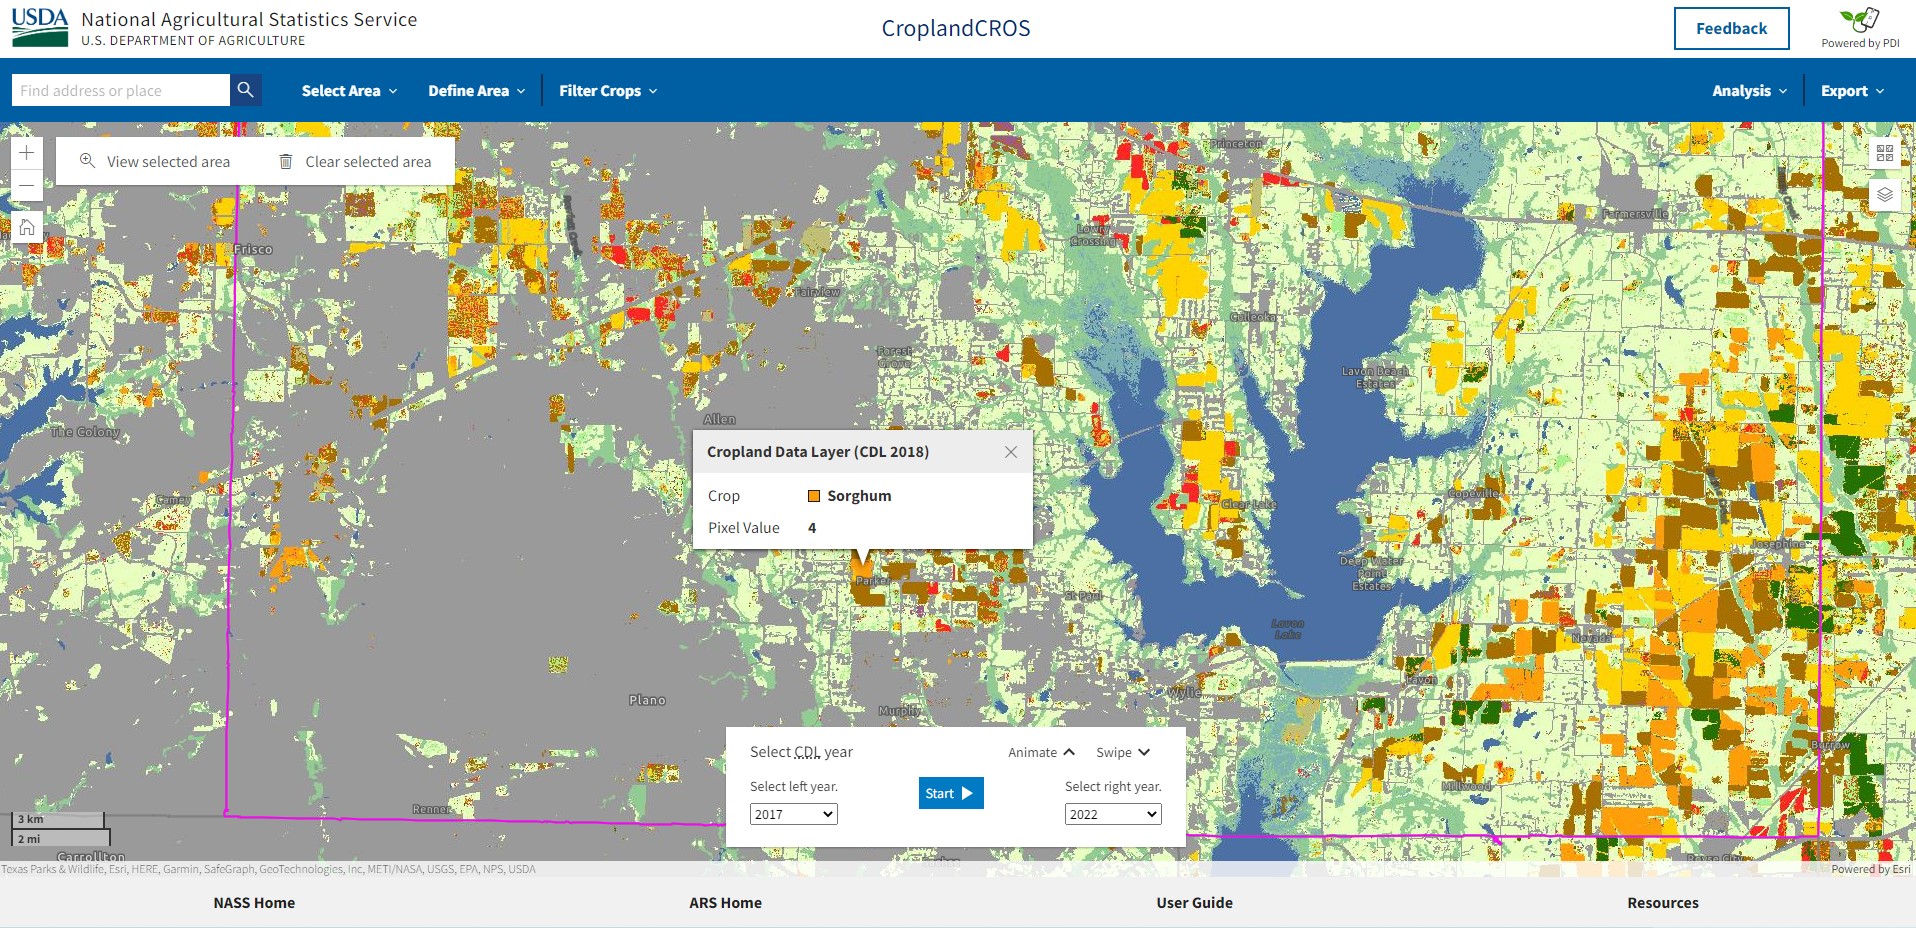
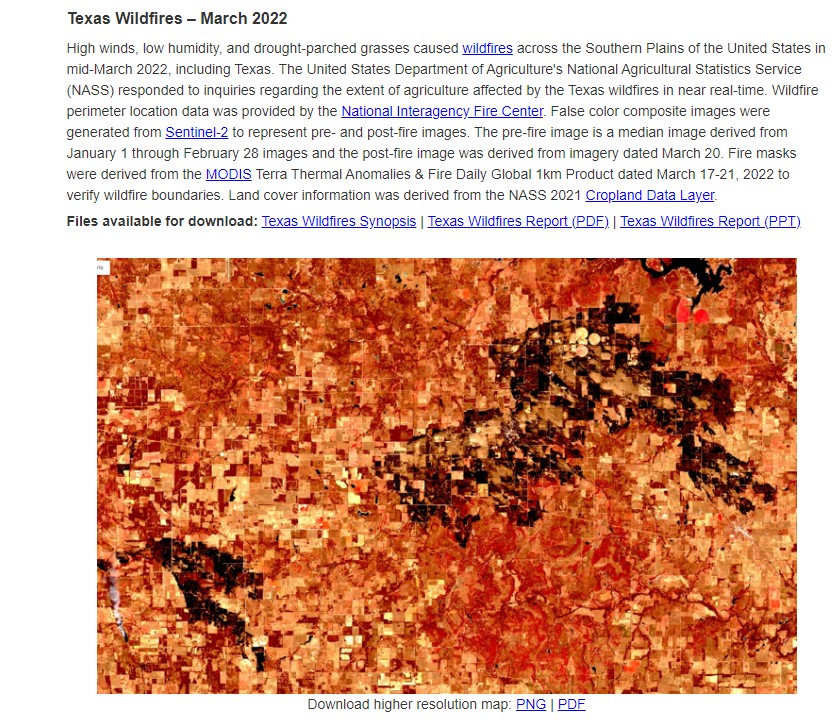
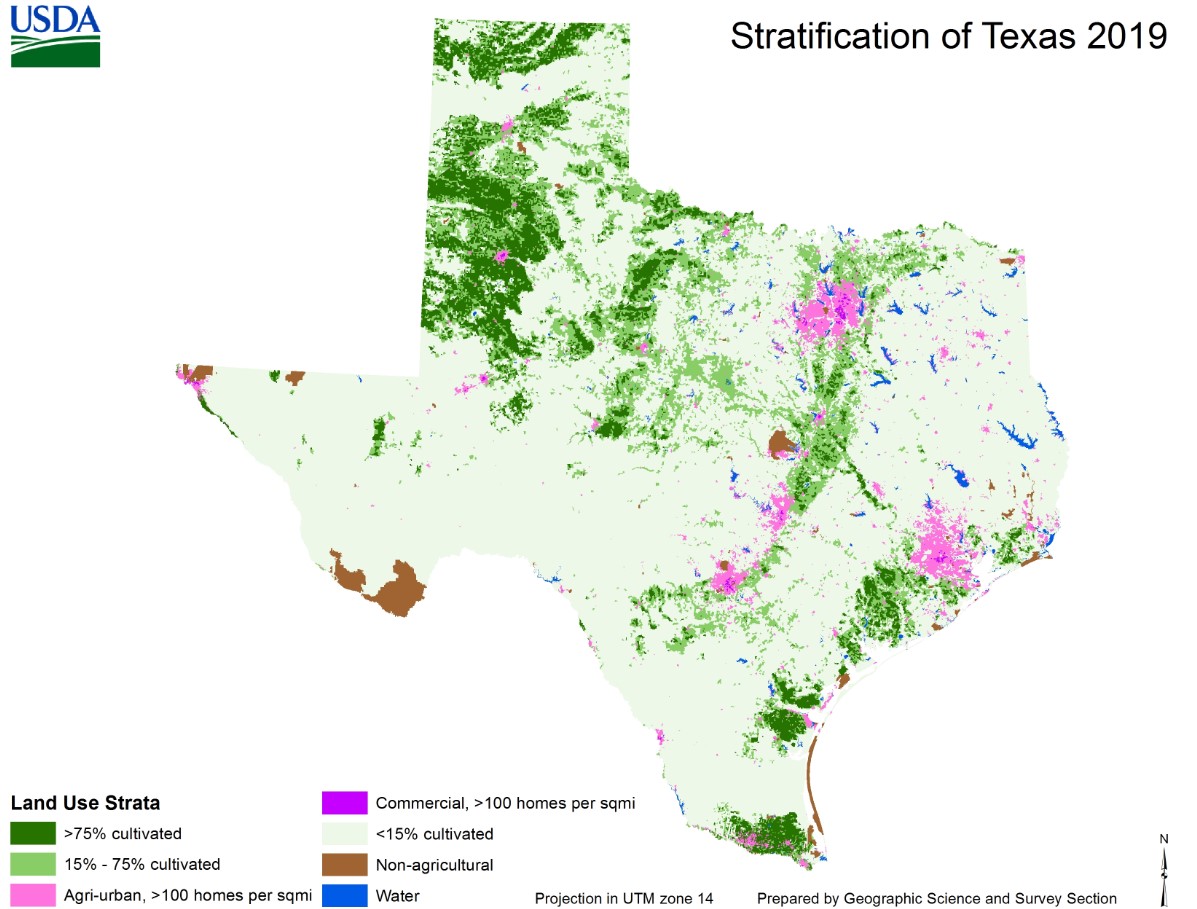
Cropland Data Layer, presented by Rick Mueller, USDA
These visualization tools are based on USDA’s Cropland data layer, which includes data collected since 2008. The cropland data visualizes land cover and land use metrics.Recent improvements include Lansat and Sentinel imagery loaded to Google Earth for faster analysis and availability. Further improvements will allow potentially biweekly 10m CONUS updates. Use cases include flood protection, drought protection, land cover change detection (visualize changes in crop type by location over time) crop progress, condition,and soil moisture (CASMA). Links to these tools, developed with Tableau, Google Earth and ESRI omponents are listed below.
| Link to Web App or Dataset | |
|---|---|
| Cropland Collaborative Research Outcomes System (CROS) |
|
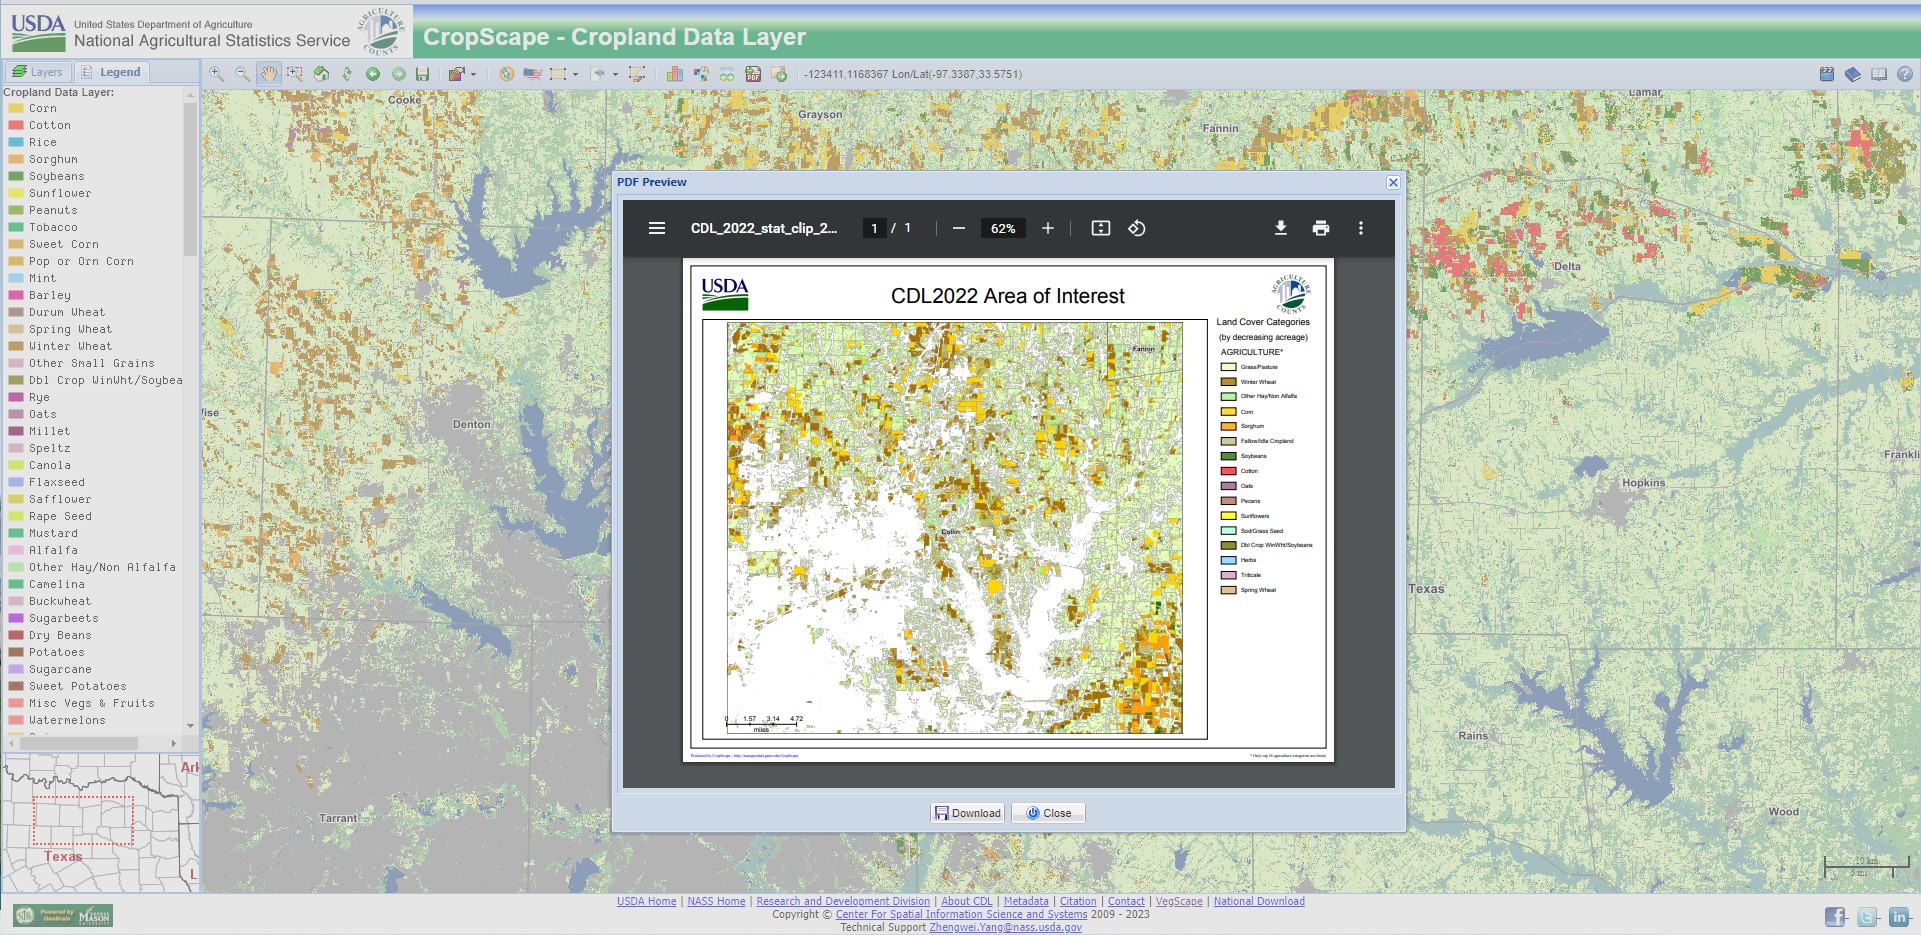
| CropScape – Cropland Data Layer |
|
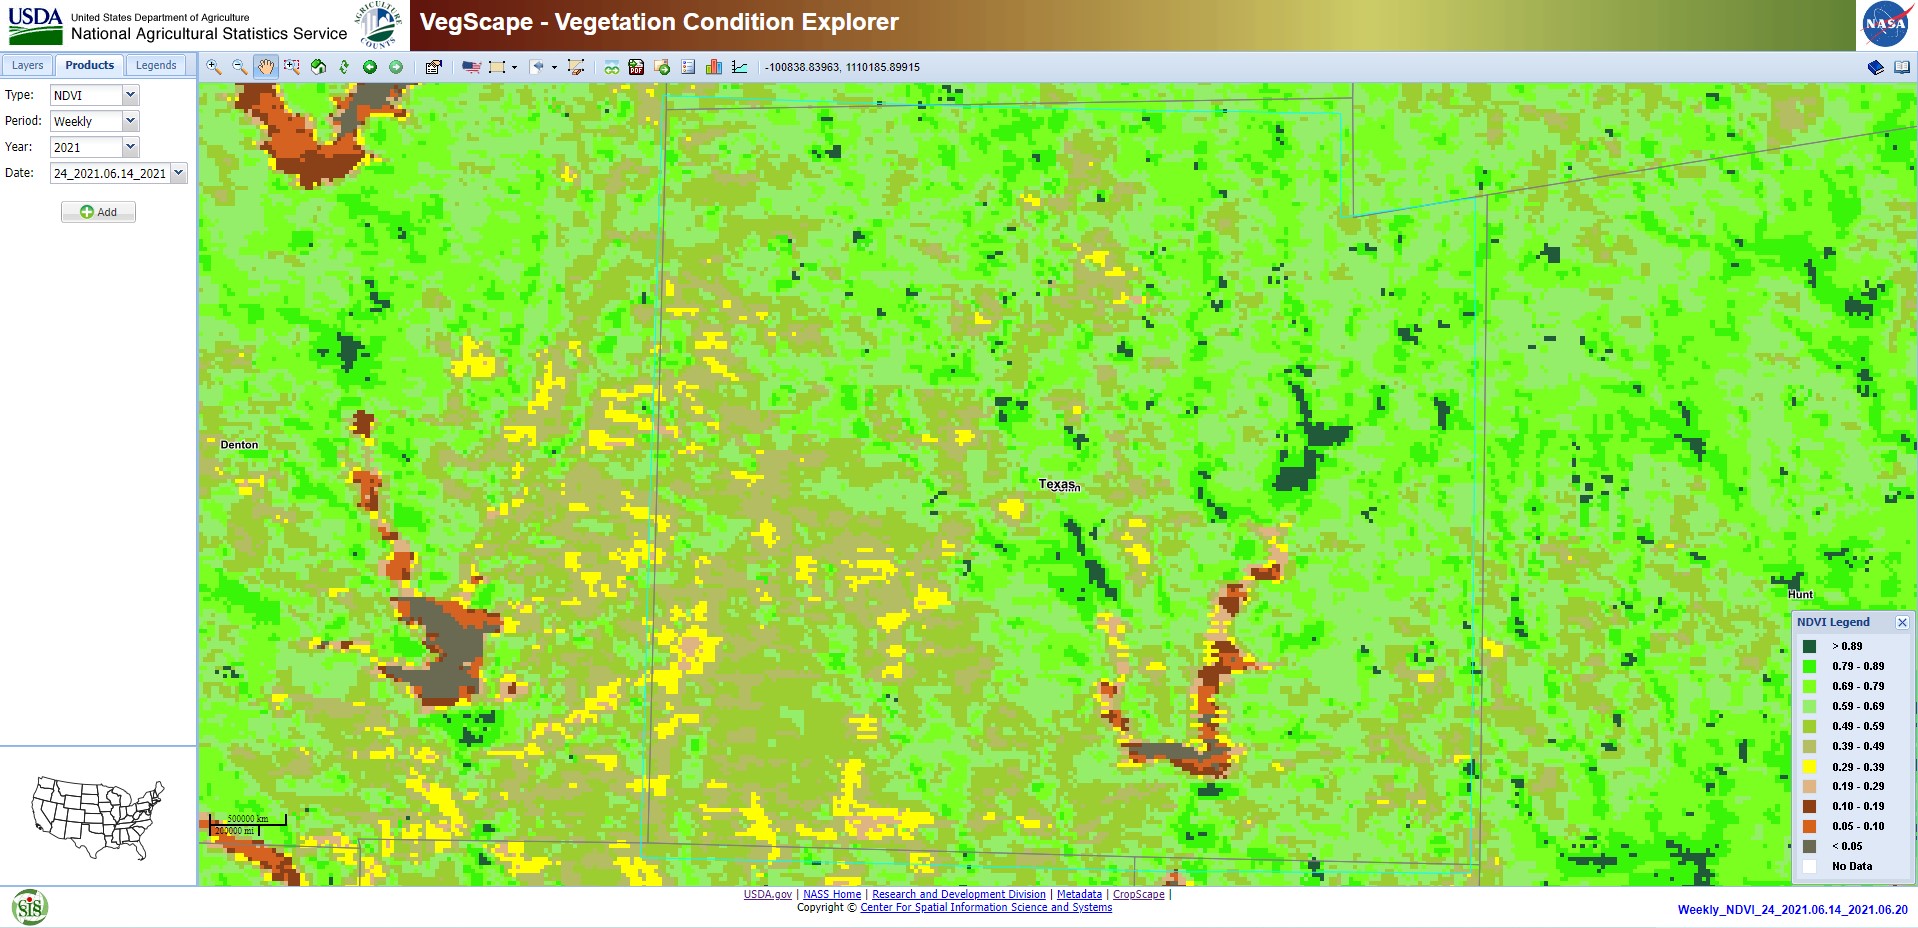
| Vegetation Condition Explorer |
|
| Disaster Analysis |
|
| Land Use Strata by State |
|
NRCS National Planning and Agreements Database (RCA Data Viewer), presented by Rodger Claassen, NRCS
The RCA Data Viewers allow users to display conservation program acres or program counts by conservation practice types, land use, program, and fiscal year.
Acres Receiving Conservation by Program and Fiscal Year
NRCS Conservation Programs
Hosted at farmers.gov, financial assistance dashboards provide a view of acres under financial assistance contracts. Mapping tool allows dirll down by state, County or Congressional District.
Financial Assistace Programs
Forest Inventory and Analysis, presented by Chris Oswald, Research Forester
The Forest Inventory and Analysis Geospatial Showcase
Built on a dataset with 22 M trees, forest inventory data is collected to understand forest use and trends.
FIA Land Resources Explorer
Visualize land use and land cover over time.
BIGMAP
National scale, modeling, mapping and analysis of US forestresources. Uses raster analytics, provides additional compute power for forest service internal data analysis projects. Catalogs: general layer – forest type,carbon levels. REST APIs, Biomass catalog, Tree species layers, Ex: Biomass of oaks in TX.
Forest Inventory and Analysis Datamart
Forest info downloadable data formats, easy drill-down by state to export sub-sets. Search by tree typefor timber product outputs.
My City’s Trees
Visualize treespecies data in cities and urban forests. Developed in collaboration with TexasA&M University.
Timber Products Output (TPO) Data Reporting Tool
Visualize tree products by county or state. A wood-flow tool is in development to visualize how timber products move between states.
Agricultural Data Sets, Data Visualization, Forest Inventory, Land Use Analytics, NRCS, USDA — Feb 23, 2023